SQL & PowerBI
PostgreSQL | Music Store Analysis

These SQL queries are used to perform data analysis on a music store database. The questions are divided into three sets - Easy, Moderate, and Advance.
The Easy set consists of five questions that can be easily answered using basic SQL commands. The questions include finding the senior-most employee based on job title, identifying the countries with the most invoices, determining the top three values of total invoice, identifying the city with the best customers based on the sum of invoice totals, and finding the best customer who has spent the most money.
The Moderate set consists of three questions that are a bit more complex than the Easy set. The questions include finding the email, first name, last name, and genre of all rock music listeners, identifying the top 10 rock bands based on the total track count, and identifying all track names that have a song length longer than the average song length.
The Advance set consists of two questions that are more challenging than the previous sets. The questions include finding how much amount spent by each customer on artists and identifying the most popular music genre for each country, where the maximum number of purchases is shared, returning all genres.
More on Github Github
Working with Facts and Dimension Tables
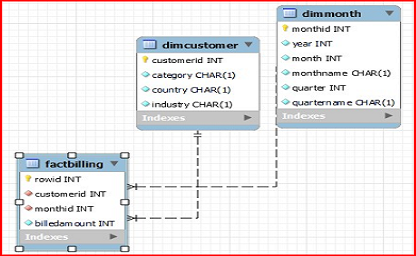
The objective of this lab is to:
- Study the schema of the given csv file
- Design the fact tables
- Design the dimension tables
- Create a star schema using the fact and dimension tables
More on Github Github
ETL Using Shell Scripts
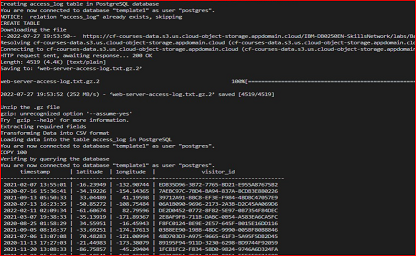
This shell script is an ETL (Extract, Transform, Load) pipeline for processing web server access logs and storing the data in a PostgreSQL database table.
The script begins by creating a table called "access_log" in the "template1" database of the PostgreSQL instance running on the local host.
Next, it downloads a compressed text file "web-server-access-log.txt.gz" from a public URL and unzips it. The file contains data about website visitors, including their timestamp, latitude, longitude, visitor ID, and other columns.
After extracting the relevant data columns (timestamp, latitude, longitude, and visitor ID) from the unzipped file using the "cut" command, the script transforms the data delimiter from "#" to "," using the "tr" command and saves the output to a CSV file called "extracted-data.csv".
Finally, the script loads the CSV file into the "access_log" table using the "\COPY" command and verifies the successful data insertion by querying the table using a SELECT statement.
Overall, this script demonstrates how to use shell commands and PostgreSQL utilities to build a simple data pipeline for processing and storing large volumes of structured data.
More on Github Github
PowerBI | Super Store Sales Analysis
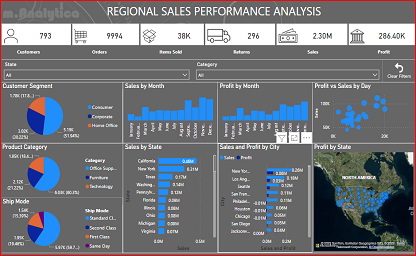
This is small exercise where data of Super Store is being explored in PowerBI.
More on Github Github
Other Similar Project on Github Github
PowerBI | Bank Customer Churn Analysis
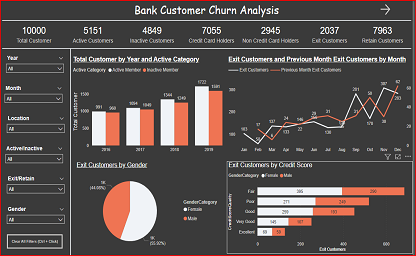
Churn analysis is a technique used to identify customers who are likely to discontinue using a product or service. It involves analyzing customer behavior and other data to understand why customers stop using a product or service, and what factors contribute to their decision to leave.
More on Github Github